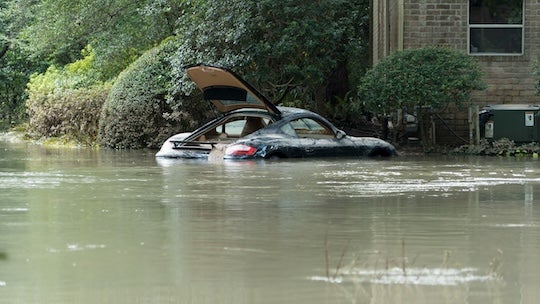
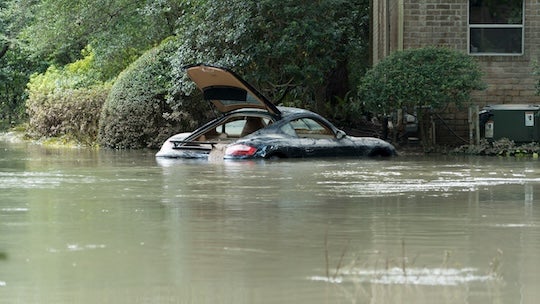
The Natural Disaster Resilience dashboard from Rice University’s Baker Institute for Public Policy compares combinations of demographics and disasters to show impacts over time and provides evidence that policy and regulation need to prioritize infrastructure resilience.
The dashboard unveiled today demonstrates the history of tropical storms, hurricanes, wildfires and tornadoes in the U.S. and is meant to provide a visualization of the often overlooked elements in conversations about disaster preparedness and recovery, said Kenneth Medlock, senior director of the Baker Institute’s Center for Energy Studies and the James A. Baker III and Susan G. Baker Fellow in Energy and Resource Economics.
“For example, urban tracts and population have expanded significantly over the last 75 years in the U.S. Gulf Coast, putting more people, infrastructure and energy assets in the path of tropical storms and hurricanes that have always threatened the region,” he said. “This has raised the risk of higher damages, which can be addressed by expanding insurance coverage, building smarter and more resilient infrastructure or both, and every option comes with a cost.

“This tool contributes to the ongoing discussions about federal policy through agencies such as FEMA, and it speaks directly to local policies, or lack thereof, related to building codes and standards and real estate development. It also connects to energy infrastructure development and operation, particularly when reliability of energy service is raised.”
Although the overall frequency and intensity of natural disasters have not increased significantly, rapid population growth and urban expansion in areas that are historically prone to natural disasters have amplified the financial and social impacts of natural disasters over time, Medlock said. The tool allows users to visualize changes in urban tracts and population density from 1950 to the present and see how those changes overlay with hurricanes and tropical storms, tornadoes and wildfires.
The data and visualization provide compelling evidence of a need for policy and regulation that prioritizes infrastructure resilience, Medlock said. It also allows a better understanding of why adaptive measures are needed in regions that are still growing rapidly and are foundational for U.S. international and domestic commerce, such as the U.S. Gulf Coast.
“In general, this tool allows the user to see how the last 75 years of urban and population expansion have shaped natural disaster risks to better understand why resilience is so important,” Medlock said. “In short, it is an eye-opening exploration of why data matter for public policy.”
The Natural Disaster Resilience dashboard is the newest of the Center for Energy Studies’ data and research visualizations. These are ongoing projects that inform dialogue by investigating drivers of energy market evolution — including market design, policy and regulation, technology and innovation, sustainability and resilience and the intersections of infrastructure, local politics and geopolitics. These include visualizations about Texas’ electricity and carbon capture.
Learn more about the Center for Energy Studies research and events here.

