For many who suffer from epilepsy, seizures come like clockwork. But everyone has a different clock.
A new study co-led by Rice University and the University of California, San Francisco (UCSF) researchers sought to formalize how those clocks tick to give people with epilepsy a better idea of how and why their seizures happen, and perhaps to better recognize the early warnings.
In the process, the project led by Rice alumna Sharon Chiang, a clinical instructor and research fellow at UCSF, and her mentor Marina Vannucci, the Noah Harding Professor of Statistics at Rice’s George R. Brown School of Engineering, established that aging itself, as well as common triggers, may be contributing factors to how the disease affects those prone to seizures.
Their study appears in the Proceedings of the National Academy of Sciences.
Epilepsy is a disorder in which surges of electrical activity in the brain cause seizures. Often, these seizures are cyclical and can be triggered by many events. But why different patients experience seizure cycles of different lengths is unknown.
“We developed a new statistical model to explicitly capture the effect of factors that may drive transitions in seizure risk,” Chiang said. “We looked at anti-seizure medications and different triggers like illness and menstrual cycles. Those are some of the factors commonly thought to increase or decrease seizure risk.
“The relationship of cycle length to age was an interesting finding,” she said. “We’re able to see there are shorter cycles in older age groups and then longer cycles in younger age groups. A shortening of cycle length with age may have potential ramifications in future clinical practice.”
In earlier studies, the group analyzed patients’ seizure diaries to assess their seizure risks and looked at brain scans to find markers for patients with epilepsy most likely to benefit from brain surgery.
The new work by Chiang, Vannucci and lead author Emily Wang, who earned her Ph.D. at Rice this year, seeks to emphasize the importance of logging seizures — and their lack — daily and over the long term. That will help establish individual chronotypes, or rhythms, for patients who experience seizures in cycles and wish to understand why seizures happen when they do, what may trigger them and how best to treat them.

An online diary that tracks seizure activity both simplifies the process for patients and provides the researchers with a wealth of data to mine for their statistical dynamical systems models, the “dynamic” part capturing change over time. Seizure Tracker, founded by co-author Robert Moss, provides tools to help patients, doctors and researchers understand relationships between seizure activity and therapies that will improve patient care.
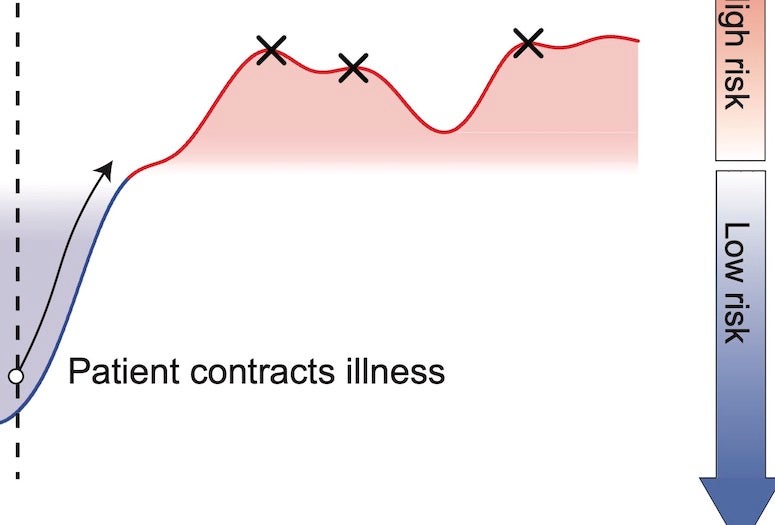
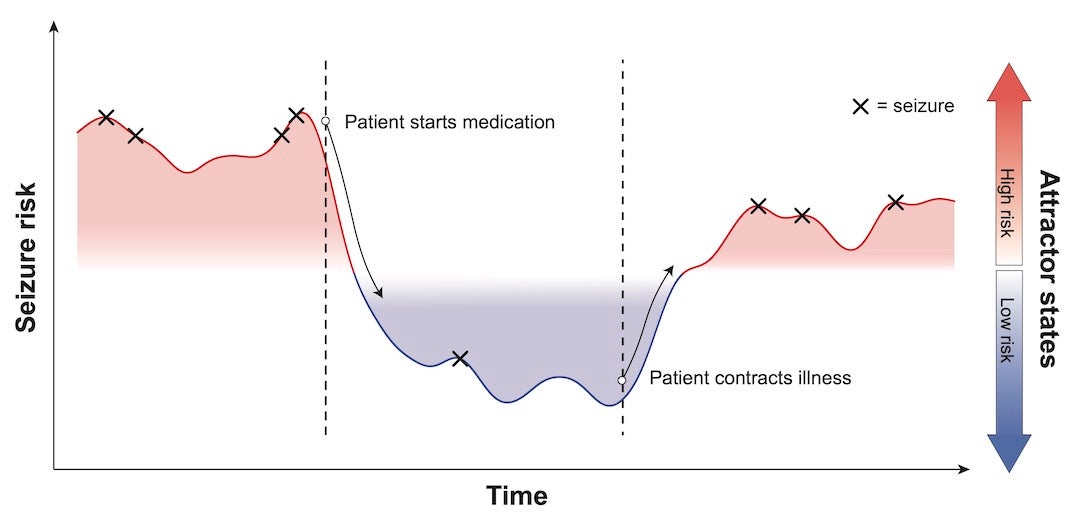
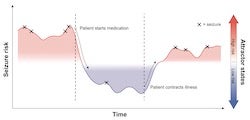
For the current study, the logs of more than 1,000 patients ages 2 months to 80 years helped the team model the relationship between “attractor states,” internal and/or external events like the start of a new medication or an illness, and the peaks and valleys of seizure activity in an individual patient.
“The purpose of this model is to try to guide the patient and the doctor, in particular,” Vannucci said. “We want to help doctors say, ‘OK, this medication is really important for this patient with this type of seizure,’ and control their seizures in a better way.”
The relevance of a patient’s age emerged from Seizure Tracker data as well. “Calm stretches between seizures seem to get shorter for patients as they get older,” Vannucci noted.
“Triggers and age are the two factors we found to be significant for the change of attractor states,” she said. “The data shows that with age, patients have shorter cycles. It seems like an obvious thing, but the link had not been formally established.”
The data is accurate for patients who can recognize and log in each seizure every day, but the researchers know people aren’t always able to do so. That’s where the team’s background in Bayesian modeling helps to fill the gaps.
Vannucci said the new study is the product of research that began in 2017. “Doctors and patients sit down and see when their seizure frequency is going up or down or is stable,” she said. “We realized we can formalize in a statistical model attractors and latent states and infer the changes over states.”
That resulted in a 2018 Epilepsia Open study that suggested a Bayesian model could better define seizure risks for patients. From there, she said the team incorporated attractors and other covariates like medications to build the model detailed in the current study.
“We hope this study is the best of all and the most helpful for patients and doctors,” Vannucci said.
Co-authors of the paper are Dr. Zulfi Haneef, an associate professor of neurology at Baylor College of Medicine and an associate professor at the Michael E. DeBakey Veterans Affairs Medical Center, Houston, and Dr. Vikram Rao, chief of the epilepsy division and associate professor of neurology at UCSF.
The Gulf Coast Consortia’s National Library of Medicine Training Program in Biomedical Informatics and Data Science (T15LM007093) and the National Institutes of Health (5R25NS070680-12) supported the research.
- Peer-reviewed research
-
A Bayesian switching linear dynamical system for estimating seizure chronotypes: https://www.pnas.org/doi/10.1073/pnas.2200822119
- Image for download
-
https://news-network.rice.edu/news/files/2022/09/0926_EPILEPSY-1-WEB.jpg
An illustration shows how an electronic diary by patients with epilepsy correlates “attractors” like new medications or illnesses with seizures over time. A study by statisticians at Rice University and the University of California, San Francisco formalizes a process by which patient and doctors might better recognize the signs of an impending seizure. (Credit: Vannucci Group/Rice University)
- Related materials
-
Seizure count forecasting to aid diagnostic testing in epilepsy: https://onlinelibrary.wiley.com/doi/10.1111/epi.17415
Patient diaries reveal propensity for epileptic seizures: https://news2.rice.edu/2019/12/04/patient-diaries-reveal-propensity-for-epileptic-seizures-2/
Statistics method shows networks differ in epileptic brains: https://news2.rice.edu/2017/03/06/statistics-method-shows-networks-differ-in-epileptic-brains/
Presurgical imaging may predict whether epilepsy surgery will work: https://news2.rice.edu/2017/12/11/presurgical-imaging-may-predict-whether-epilepsy-surgery-will-work-2/
Connections: Sharon Chiang (video): https://www.youtube.com/watch?v=yZA5Fbo56SQ
Vannucci group: http://marina.blogs.rice.edu
Rice Department of Statistics: https://statistics.rice.edu
George R. Brown School of Engineering: https://engineering.rice.edu
- About Rice
-
Located on a 300-acre forested campus in Houston, Rice University is consistently ranked among the nation’s top 20 universities by U.S. News & World Report. Rice has highly respected schools of Architecture, Business, Continuing Studies, Engineering, Humanities, Music, Natural Sciences and Social Sciences and is home to the Baker Institute for Public Policy. With 4,240 undergraduates and 3,972 graduate students, Rice’s undergraduate student-to-faculty ratio is just under 6-to-1. Its residential college system builds close-knit communities and lifelong friendships, just one reason why Rice is ranked No. 1 for lots of race/class interaction and No. 1 for quality of life by the Princeton Review. Rice is also rated as a best value among private universities by Kiplinger’s Personal Finance.

